|
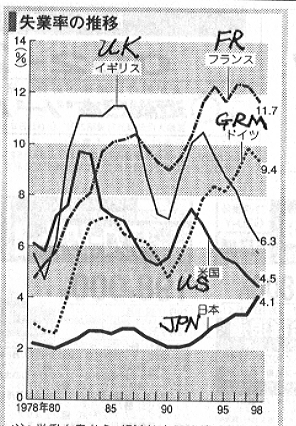
| Source: Asahi N.P., 9/12/99 |
| Remarks: |
|
|
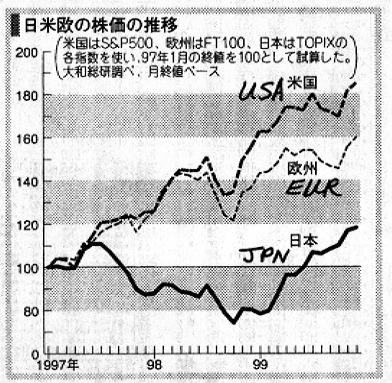
| Source: Asahi N.P., 9/12/99 |
| Remarks: |
Stock Prices (1997 - 1999/200): International Comparison
|
|
|
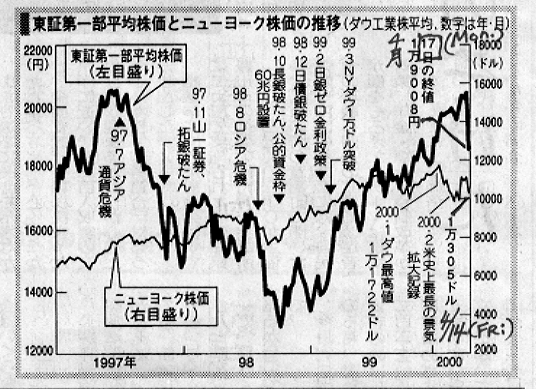
| Source: Asahi N.P., 12/29/99 | Source: Asahi N.P., 4/18/00 | Source: Asahi N.P., 3/13/01 |
| Remarks: See <<8/31/98>> for the reasons for the world-wide fall in the stock prices around the summer of 1998. | Remarks: |
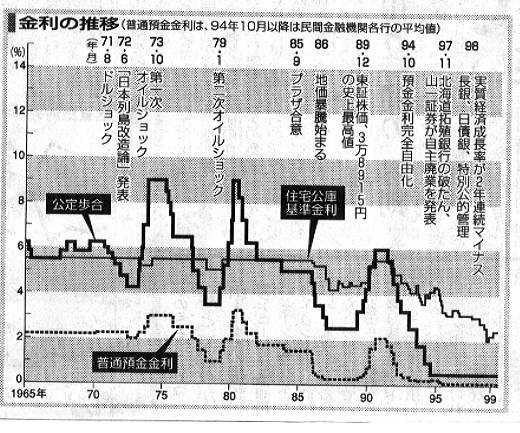
Japanese Discount Rate, 1965 - 1999
|
| Source: Asahi N.P., 7/17/99 |
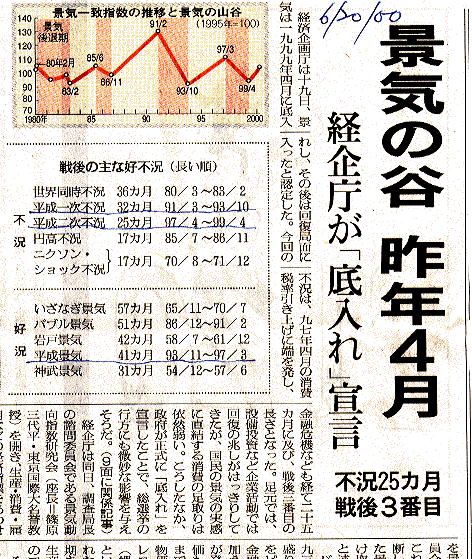
Japanese Business Cycle, 1980 - 2000
|
| Source: Asahi N.P., 6/20/00 |
Credit Expansion and Credit Crunch in Japan:
| 1987-1990/91 |
Banks lend firms aggresively.
[Low interest rate [See Plots 5: Outstanding of Loans of All Banks in Jpn (全国銀行貸出残高) and its growth rate.] |
| 1990/91-present |
[See Plots 5: Outstanding of Loans of All Banks in Jpn (全国銀行貸出残高) and its growth rate.] Banks become highly reluctant to lend.
[Prcies of assets (stock, land and real estate) that firms had purchased and relied on as collateral for further borrowing from banks fell sharply. |
Highlights of yen_dollar exchange rate and Jpn economy:
A
B
1972q2
Adjustment period: December 1971 to February 1973.
1973q1
The flexible exchange rate system started: The major currencies began to float.
1973q4
First Oil Crisis: $2.60 to $11.7 a barrel (more than fourfold increase) in a single year
1978q4
Second Oil Crisis: $12.7 to $34 a barrel (a rise by 300%) over a period of 34 months (from 1979 to October 1981)
1985q3
Plaza Agreement: Revaluation of the yen (depreciation of the dollar). [See Plots 1: Yen Exchange Rate and Jpns GDP growth rate.]
1985q4
High-yen recession: from 1986 to 1987
1988q1
High-yen boom (Heisei Boom): from 1987/88 to 1989. [See Plots 2: Jpns Stock Price and GDP growth rate; Plots 3: Oil Price and Jpns Land Price.]
1991q2
Heisei Recession: from 1990 to present. [See Plots 2: Jpns Stock Price and GDP growth rate; Plots 3: Oil Price and Jpns Land Price.]
1997q3
Unstable Asian currencies [See Plots 4: Recent Asian Stock Price and Exchange Rate Behavior.]