| 1945:8 | 第2次世界大戦終結 The end of WW II. |
1954:12 - 1957:6 | 神武景気 Jinmu Boom. |
1958:7 - 1961:12 | 岩戸景気 Iwato Boom. |
1965:11 - 1970:7 | いざなぎ景気 Izanagi Boom. |
1970:8 - 1971:12 |
ニクソンショック不況 Recession due to the Nixon shock.
|
| 1973:2から3 |
日本など主要国の為替レートが変動相場制に全面移行.A flexible exchangre rate system starts for major currencies such as Japanese yen.
|
| 1973:10 |
第1次石油危機=1バレル当たり約3ドルから12ドルへ.The first oil crisis.
|
1973:12 - 1975:3 |
(第1次石油危機に因る)不況(スタグフレーション)Stagflation (=stagnation and inflation simultaneously) due to the first oil crisis. [=低成長と高い失業率(スタグネーション)+物価上昇(インフレーション);猪木武徳(2009, pp.228-231; 失業率上昇、賃金コスト上昇の原因/背景はpp.240-242も)] |
| 1979 |
第2次石油危機による原油価格高騰 The second oil crisis. [=1979年1年くらいかけて,1バレル当たり11.7ドルから34ドルへ急騰(値上げ幅は第1次石油危機と比較して第2次石油危機の方が大きく,それだけ第2次石油危機の方が日本経済への影響はより大であったと考えられる)]
|
1980:3 - 1983:2 |
(第2次石油危機による原油価格高騰に因る)世界同時不況(スタグフレーション)Stagflation due to the second oil crisis. [36ヶ月=戦後最長不況] |
1985:7 - 1986:11 | (1985年9月22日プラザ合意の直後、急激な円高に因る)円高不況 High-yen recession [Sharp yen appreciation immediately after the Plaza Accord reached on 9/22/1985]. |
1986:12 - 1991:2 | 円高景気[バブル好況]High-yen boom/bubble. |
| 以後10年 The next decade. | 「失われた10年」A lost decade:深刻なデフレ;円の国際化にブレーキ[小林&中林(2010, p. vii)] |
| 以後20年 The next two decades. | 「失われた20年」Two lost decades.[野田 稔(2010, p.58)] |
1991:3- 1993:10 | バブル崩壊後不況[平成1次不況]Heisei first recession. |
1993:11 - 1997:5 | 平成景気 Heisei boom. |
1997:6 - 1999:1 |
金融危機不況[平成2次不況]Recession due to financial crisis/Heisei second recession.
|
1999:2 - 2000:11 | IT バブル好況 IT boom/bubble. |
2000:12 - 2002:1 | IT バブル崩壊後不況 IT recession. |
2002:2 - 2007:10 |
戦後最長好況 A boom, the longest in the post-war period.
|
2007:11 - 2009:3 (2009:3=1番底かも) |
リーマンショック不況 Recession due to the Lehman shock.
|
2009:4 - 20??:? (20??:?=2番底かも) |
|
- Source = ビジネスデータ出所,など: SAINSポータル: ...,の「聞蔵IIヴィジュアル[朝日新聞」(同時利用者3人まで)で、以下を検索:景気の谷、2010年6月8日(朝)。
- 記事 (pdf) =「「景気の谷」は昨年3月 下降の速さ、過去最大 内閣府」
- Source = 日本経済白書,等= http://www5.cao.go.jp/keizai3/whitepaper.html
- 平成21年度年次経済財政報告(平成21年7月24日):
第1章 急速な景気後退に陥った日本経済:
第1節 今回の景気後退の特徴:
1 全体的な特徴:
コラム1-1表:日米の景気基準日付= http://www5.cao.go.jp/j-j/wp/wp-je09/09c01010.html
- Source = aWebsite_平夫:
excel_highlights.html (on "Highlights of yen_dollar exchange rate and Jpn economy; Credit expansion and crunch (1970q1 - present)"):
-
Japanese Business Cycle, 1954-1999
Source: Asahi N.P., 6/20/00
[RATS program]
- Source = Books, Papers in LaTex: Business Forecasting&PanelDtAnlys (Incld. Anderson): BJt.s.a._1: Stats_auto.prg:
-
CORRECT setting of month and quarter: /* For quaterly data only: [8] set oilcr2 = t==1978:4.or.t==1979:1 [9] set depression = t>=1980:1.and.t<=1983:1.or.$ [10] t>=1985:3.and.t<=1986:4.or.$ [11] t>=1991:1.and.t<=1993:4.or.$ [12] t>=1997:2.and.t<=1999:1.or.$ [12a] t>=2000:4.and.t<=2002:1.or.$ [12b] t>=2007:4.and.t<=2009:1 */ * < For monthly data only: set oilcr2 = t==1978:12.or.t==1979:3 set depression = t>=1980:3.and.t<=1983:2.or.$ t>=1985:7.and.t<=1986:11.or.$ t>=1991:3.and.t<=1993:10.or.$ t>=1997:6.and.t<=1999:1.or.$ t>=2000:12.and.t<=2002:1.or.$ t>=2007:11.and.t<=2009:3 * > - 上記RATS program解説その1
- Source = Books, Papers in LaTex:
Business Forecasting&PanelDtAnlys (Incld. Anderson):
LaTeX_1rev2010:
ch_dataplots.tex:
-
[8] 1978年第4四半期から1979年第1四半期(1978年12月から1979年1月)にかけて第2次石油危機による原油価格高騰(RATSのグラフで,この時期にグリッド線を挿入するため上のように設定):この後1年くらいかけて,1バレル当たり11.7ドルから34ドルへ急騰.
1973年10月の第1次石油危機では約3ドルから12ドルへ.値上げ幅は第1次,第2次石油危機でそれぞれ約10ドル,22ドルで後者の方が大きく,それだけ第2次石油危機の方が日本経済への影響はより大であったと考えられる.
[9] 1978年第4四半期から1979年第1四半期(1978年12月から1979年1月)にかけて第2次石油危機による原油価格高騰に因る世界同時不況期(RATSのグラフで,この時期を網掛けするため上のように設定).ここで\$記号は「次の行に続く」の意味.
[10] 1985年9月プラザ合意直後の急激な円高に因る円高不況期.
[11] バブル崩壊後の平成1次不況期.
[12] バブル崩壊後の平成2次不況期.
- Source = Books, Papers in LaTex:
Business Forecasting&PanelDtAnlys (Incld. Anderson):
LaTeX_1rev2010:
ch_dataplots.tex:
- 上記RATS program解説その2
- Source = 学部、学科_雑務,講義要綱etc:
ビジネス時.分.演習:
ビ時分演習_2010:
BTSA_LectNote_2010.html:
-
[12a] ITバブル崩壊不況期=2000年第4四半期ー2002年第1四半期
日本経済の最近の景気変動:
景気拡大期=2002年2月-2007年10月(69ヶ月=戦後最長);
[12b] 景気後退期=2007年11月-2009年3月(特に2008年9月=リーマンショック)
- Source = 学部、学科_雑務,講義要綱etc:
ビジネス時.分.演習:
ビ時分演習_2010:
BTSA_LectNote_2010.html:
- ビジネスデータ出所,など: SAINSポータル: ...,の「聞蔵IIヴィジュアル[朝日新聞]」(同時利用者3人まで)で、以下を検索:献金、2010年5月29日(朝)。
- 5-29-2010朝:記事 (pdf) =「経済状況と内閣、そして経団連の動き」
- Source = aWebsite_平夫:
excel_highlights.html (on "Highlights of yen_dollar exchange rate and Jpn economy; Credit expansion and crunch (1970q1 - present)"):
- 様々なデータ:
- Unemployment rates (1978 - 1998): International Comparison
Source: Asahi N.P., 9/12/99 Remarks: - Stock Prices (1997 - 1999/200): International Comparison
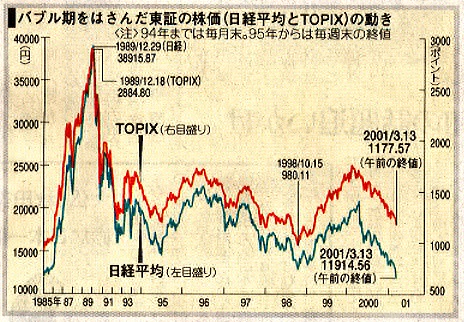
Source: Asahi N.P., 12/29/99 Source: Asahi N.P., 4/18/00 Source: Asahi N.P., 3/13/01 Remarks: See <<8/31/98>> for the reasons for the world-wide fall in the stock prices around the summer of 1998. Remarks: - Japanese Discount Rate, 1965 - 1999
Source: Asahi N.P., 7/17/99 - Credit Expansion and Credit Crunch in Japan:
1987-1990/91 Banks lend firms aggresively. [Low interest rate
Excessive funds available
-> Credit Expansion][See Plots 5: Outstanding of Loans of All Banks in Jpn (全国銀行貸出残高) and its growth rate.]
1990/91-present [See Plots 5: Outstanding of Loans of All Banks in Jpn (全国銀行貸出残高) and its growth rate.] Banks become highly reluctant to lend.
[Prcies of assets (stock, land and real estate) that firms had purchased and relied on as collateral for further borrowing from banks fell sharply.
->Firms turn out unable to repay.
-> Bad loans, accumulated inside banks
-> Banks' equity capital was reduced when their bad loans are disposed.
(See financial statements for "equity capital" as against "debt capital.")
-> Bank share prices fell down.
-> Reluctance to lend
-> Credit Crunch: Credit or funds less available than needed by firms] - Highlights of yen_dollar exchange rate and Jpn economy:
A B 1972q2 Adjustment period: December 1971 to February 1973. 1973q1 The flexible exchange rate system started: The major currencies began to float. 1973q4 First Oil Crisis: $2.60 to $11.7 a barrel (more than fourfold increase) in a single year 1978q4 Second Oil Crisis: $12.7 to $34 a barrel (a rise by 300%) over a period of 34 months (from 1979 to October 1981) 1985q3 Plaza Agreement: Revaluation of the yen (depreciation of the dollar). [See Plots 1: Yen Exchange Rate and Jpns GDP growth rate.] 1985q4 High-yen recession: from 1986 to 1987 1988q1 High-yen boom (Heisei Boom): from 1987/88 to 1989. [See Plots 2: Jpns Stock Price and GDP growth rate; Plots 3: Oil Price and Jpns Land Price.] 1991q2 Heisei Recession: from 1990 to present. [See Plots 2: Jpns Stock Price and GDP growth rate; Plots 3: Oil Price and Jpns Land Price.] 1997q3 Unstable Asian currencies [See Plots 4: Recent Asian Stock Price and Exchange Rate Behavior.]
- Unemployment rates (1978 - 1998): International Comparison