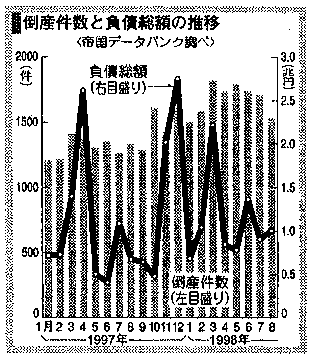
| Left scale (for Bar graph): the number of bankrupt firms | Right scale (for Line graph): the amount of corporate debt of bankrupt firms in Trillions of Yen |
 |
Left scale (for Bar graph):
- The percentage increase in the number of bankrupt firms (bar graph and left scale) from last August to this August (i.e., the growth rate of the number of bankrupt firms between last August and this August) was 15.4%.
- The percentage increase between the same months in two adjacent years has occurred continuously for the last 15 consecutive months!
| Right scale (for Line graph):
- The amount of corporate debt of bankrupt firms (line graph and right scale) for this August has become the largest for August in the postwar period.
- The percentage increase in the corporate debt from last August to this August was as large as 49.0%.
|
| The percentage increase in the number of workers of bankrupt firms from last August to this August was as large as 29.4%! |
| All of this is due to the bankurptcy in August of such large firms as Ohkura Shyoji and Mita Industries, which were listed on the Tokyo Stock Exchange. |
Further (technical) characteristics:
- Seasonality in the amount of corporate debt of bankrupt firms (line graph): Increase in spring (March/April) and in winter (December).
- The similar seasonality seems present in the number of bankrupt firms (bar graph).
|
| Data Source: Asahi News Paper, Morining Edition, 9/15/98 |