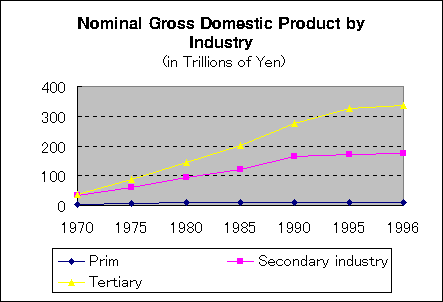

| Nominal GDP in Trillions of Yen | ||||
| Primary industry | Secondary industry | Tertiary industry | ||
| 1970 | 4.5 | 32.7 | 38.6 | |
| 1975 | 8.1 | 59.9 | 86.2 | |
| 1980 | 8.8 | 94.1 | 146.1 | |
| 1985 | 10.2 | 121 | 202.5 | |
| 1990 | 10.9 | 165.8 | 275.2 | |
| 1995 | 9.4 | 171 | 325 | |
| 1996 | 9.3 | 175 | 336 | |
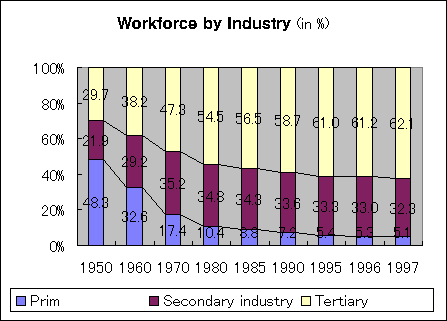
| % of Workforce | ||||
| Primary industry | Secondary industry | Tertiary industry | ||
| 1950 | 48.3 | 21.9 | 29.7 | 99.9 |
| 1960 | 32.6 | 29.2 | 38.2 | 100.0 |
| 1970 | 17.4 | 35.2 | 47.3 | 99.9 |
| 1980 | 10.4 | 34.8 | 54.5 | 99.7 |
| 1985 | 8.8 | 34.3 | 56.5 | 99.6 |
| 1990 | 7.2 | 33.6 | 58.7 | 99.5 |
| 1995 | 5.4 | 33.3 | 61.0 | 99.7 |
| 1996 | 5.3 | 33.0 | 61.2 | 99.5 |
| 1997 | 5.1 | 32.3 | 62.1 | 99.5 |
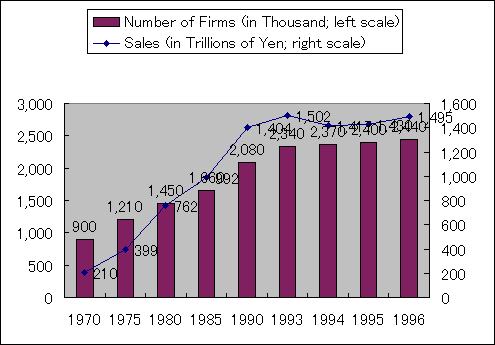
| Number of Firms and Sales | ||||
| Number of Firms (in Thousand; left scale) | Sales (in Trillions of Yen; right scale) | |||
| 1970 | 900 | 210 | ||
| 1975 | 1,210 | 399 | ||
| 1980 | 1,450 | 762 | ||
| 1985 | 1,660 | 992 | ||
| 1990 | 2,080 | 1,404 | ||
| 1993 | 2,340 | 1,502 | ||
| 1994 | 2,370 | 1,417 | ||
| 1995 | 2,400 | 1,430 | ||
| 1996 | 2,440 | 1,495 | ||
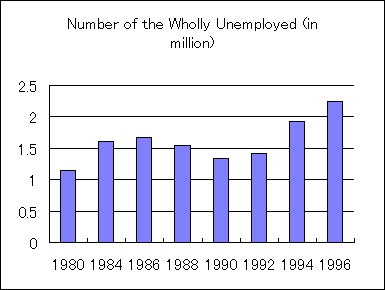
| Number of the Wholly Unemployed (in million) | ||||
| 1980 | 1.14 | |||
| 1984 | 1.61 | |||
| 1986 | 1.67 | |||
| 1988 | 1.55 | |||
| 1990 | 1.34 | |||
| 1992 | 1.42 | |||
| 1994 | 1.92 | |||
| 1996 | 2.25 | |||
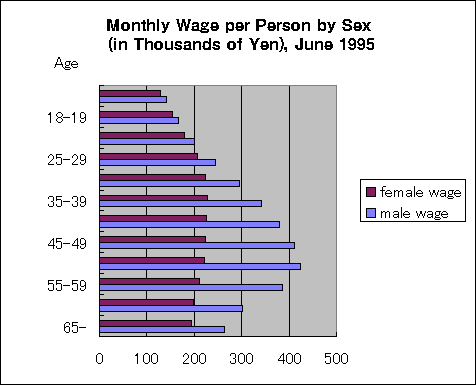
| Wage (in Thousands of Yen), June 1995 | ||||
| age | male wage | female wage | ||
| 65- | 263 | 194 | ||
| 60-64 | 301 | 198 | ||
| 55-59 | 386 | 212 | ||
| 50-54 | 424 | 221 | ||
| 45-49 | 412 | 223 | ||
| 40-44 | 379 | 225 | ||
| 35-39 | 342 | 227 | ||
| 30-34 | 296 | 224 | ||
| 25-29 | 245 | 206 | ||
| 20-24 | 200 | 179 | ||
| 18-19 | 167 | 153 | ||
| -18 | 141 | 128 | ||
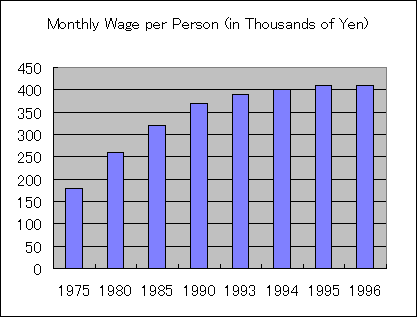
| Monthly Wage per Person (in Thousands of Yen) | ||||
| Monthly Wage per Person (in Thousands of Yen) | ||||
| 1975 | 180 | |||
| 1980 | 260 | |||
| 1985 | 320 | |||
| 1990 | 370 | |||
| 1993 | 390 | |||
| 1994 | 400 | |||
| 1995 | 410 | |||
| 1996 | 410 |