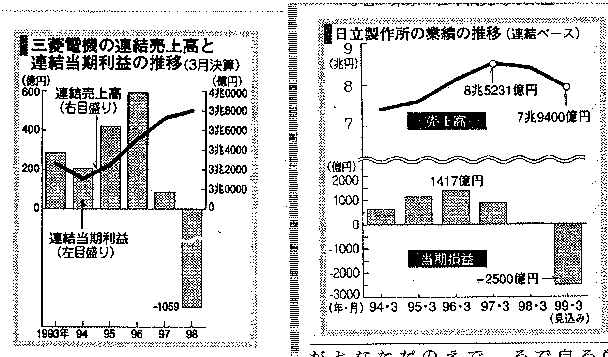
Most recent consolidated data on Mfg: Electrical Appliances (Mitubishi and Hitachi), -FY1997
1. Notice the fall in the (consolidated) profit--bar graph-- for FY1996 (as of March, 1997) and 1997 (as of March, 1998).
2. (Consolidated) sales--line graph--exhibit different pattern for these FYs: upward trend for Mitubishi, downward for Hitachi.
3. Also note that Hitachi at this time predicts the significant loss for FY1998 (March, 1999).
1. [Left] Mitubishi: Consolidated sales--line graph [right scale (in 0.1 Bills. of Yen)];
Consolidated profit--bar graph [left scale (in 0.1 Bills. of Yen)] |
2. [Right] Hitachi: Consolidated sales--line graph [top (in Trills. of Yen)];
Consolidated profit--bar graph [bottom (in 0.1 Bills. of Yen)] |
 |
| Data Source for 1: Asahi News Paper, Morining Edition, 8/19/98 |
Data Source for 2: Asahi News Paper, Morining Edition, 9/4/98 |